-
Type:
New Feature
-
Status: Resolved
-
Priority:
 Major
Major
-
Resolution: Fixed
-
Affects Version/s: None
-
Component/s: CI/CD
-
Tags:
-
Team:PLATFORM
-
Sprint:nxplatform 11.1.23, nxplatform 11.1.25, nxplatform 11.1.24
-
Story Points:1
In order to better track usage per team.
This is not only about billing, it's also to understand which team/job uses the most resources and to avoid allocating a huge amount of pods uselessly.
For now, what seems clear is that we need to filter and aggregate the usage data stored in BigQuery. The natural keys are "project" and "namespace", however, this is not enough for what we need.
As a result, we need to add labels to each resource we allocate in Jenkins X.
It should be possible to add a few labels to each resource we create.
As a first step we can propose:
- team: platform, gang, nos, devtools …
- usage: build, preview, ftest, infra (nexus, chart museum …)
- branch: master, NXP-xxx
See Labels and Selectors.
--------------------------------------------------------------------------------------------
TL;DR
Adding labels to all the Kubernetes resources used by the platform team is not trivial, yet we've managed to add some labels to the main resources: pods running the pipelines and used for the ARender preview.
Problem
Cover the resources used by a dedicated Jenkins X instance (aka team) is not trivial since:
- There are many different kinds of resources:
- daemonsets
- deployments
- ingresses
- namespaces
- persistentvolumes
- pods
- replicasets
- services
- ...
- It's hard to always find out how/when/by whom these resources are created.
First Step
As a first step, we've managed to add labels to some of the resources related to the platform team:
Pipeline pods (slaves)
They run in the platform namespace.
Labels applied:
team: platform
resource: pod
usage: build
branch: master/PR-xxxx
Redis master pods
They run in a dedicated namespace created by the nuxeo/nuxeo pipeline, "nuxeo-unit-tests-redis-master" for instance.
Labels applied:
team: platform
resource: pod
usage: utests
branch: master/PR-xxxxxx
ARender preview resources
They run in a dedicated namespace created by the nuxeo-arender-connector pipeline with jx preview, "nuxeo-arender-pr-100" for instance.
Labels applied:
team: platform
resource: pod/service
usage: preview
This includes deployments and services for each microservice as well as the nuxeo Helm chart resources.
Limitations
Yet, here is a set of resources to which we didn't manage or have time to add any labels, and we are probably forgetting some:
The Jenkins X resources themselves!
Basically, what is installed by the Jenkins X platform Helm chart: mainly the Jenkins, Nexus, Docker registry, and ChartMuseum deployments.
Workaround: query on namespace="platform" AND myLabels IN (('app', 'jenkins'), ('app', 'nexus'), ...).
Approach: we could use our own Helm chart to install the Jenkins X platform with custom labels and/or open a PR to be able to add custom labels when installing the existing chart.
Kaniko pods run by Skaffold
Basically, any time we build a Docker image: builders, platform, ...
There doesn't seem to be a simple way of doing it.
Workaround: query on namespace="platform" AND myLabels IN (('skaffold-kaniko': 'skaffold-kaniko')).
Approach: There's an issue about adding annotations to Kaniko pods: https://github.com/GoogleContainerTools/skaffold/issues/1759. We could create a GitHub issue for labels.
Redis resources other than the master pod
This includes services, statefulsets, ...
Workaround: get the Redis namespaces with:
kubectl get pod -A -l team=platform,app=redis -o=jsonpath='{.items[*].metadata.namespace}'
then for each namespace get all the resources with:
kubectl get all -n NAMESPACE --show-labels
Approach: we could update our nuxeo-redis Helm chart to allow custom labels in the templates.
Resources deployed by the nuxeo Helm chart requirements
E.g. mongodb, postgresql, elasticsearch.
Workaround: same as Redis.
Approach: same as Redis.
Possible Approaches
The current solution is not exhaustive and seems kind of hackish as we need to hook in a lot of places to add the labels and we're duplicating some code.
In the future, it should be improved with a more global and sustainable solution:
- Use a jx wrapper to inject the labels for each command such as jx step helm install or jx preview. In fact, this is what jx itself is doing by patching the Helm chart YAML...
- Have a Kubernetes operator handling it whenever a pod, namespace or whatever resource is started from the platform namespace.
Querying Resource Usage with BigQuery
This is an example of what can be done to retrieve the resource usage for the "team: platform" label and the Kaniko pods.
See https://console.cloud.google.com/bigquery?hl=fr&project=jx-preprod&j=bq:EU:bquxjob_39d9714_16f1e027b19&page=queryresults.
SELECT *
FROM
  `jx-preprod.GoogleBillingDetails.gke_cluster_resource_usage`, unnest(labels) as myLabels
WHERE
  cluster_name = "jx-prod"
AND
  myLabels IN (('team', 'platform'))
OR
  (namespace="platform" AND myLabels IN (('skaffold-kaniko', 'skaffold-kaniko')))
order by end_time desc
limit 50
Not 100% sure about the difference between the gke_cluster_resource_usage and gke_cluster_resource_consumption tables.
According to https://cloud.google.com/kubernetes-engine/docs/how-to/cluster-usage-metering#view_in_bigquery:
- gke_cluster_resource_usage => resource requests
- gke_cluster_resource_usage_consumed => ressource consumption (except in our case the table is gke_cluster_resource_consumption).
There seems to always be a delay between the results returned from the consumption table and the usage one...
The usage.amount and usage.unit fields can be interesting.
Querying Resources Filtered by Labels with kubectl
See http://kubernetesbyexample.com/labels/.
Some useful examples below.
Get labels for a given pod:
kubectl get pod POD_NAME --show-labels
Get labels for all resources of a given namespace:
kubectl get all -n NAMESPACE --show-labels
Filter pods by label (-A to list the requested objects across all namespaces):
kubectl get pods -A -l team=platform
kubectl get pods -A -l 'team in (platform, webui)'
kubectl get pods -A -l team=platform,usage=utests
kubectl get pods -A -l team=platform,usage=preview
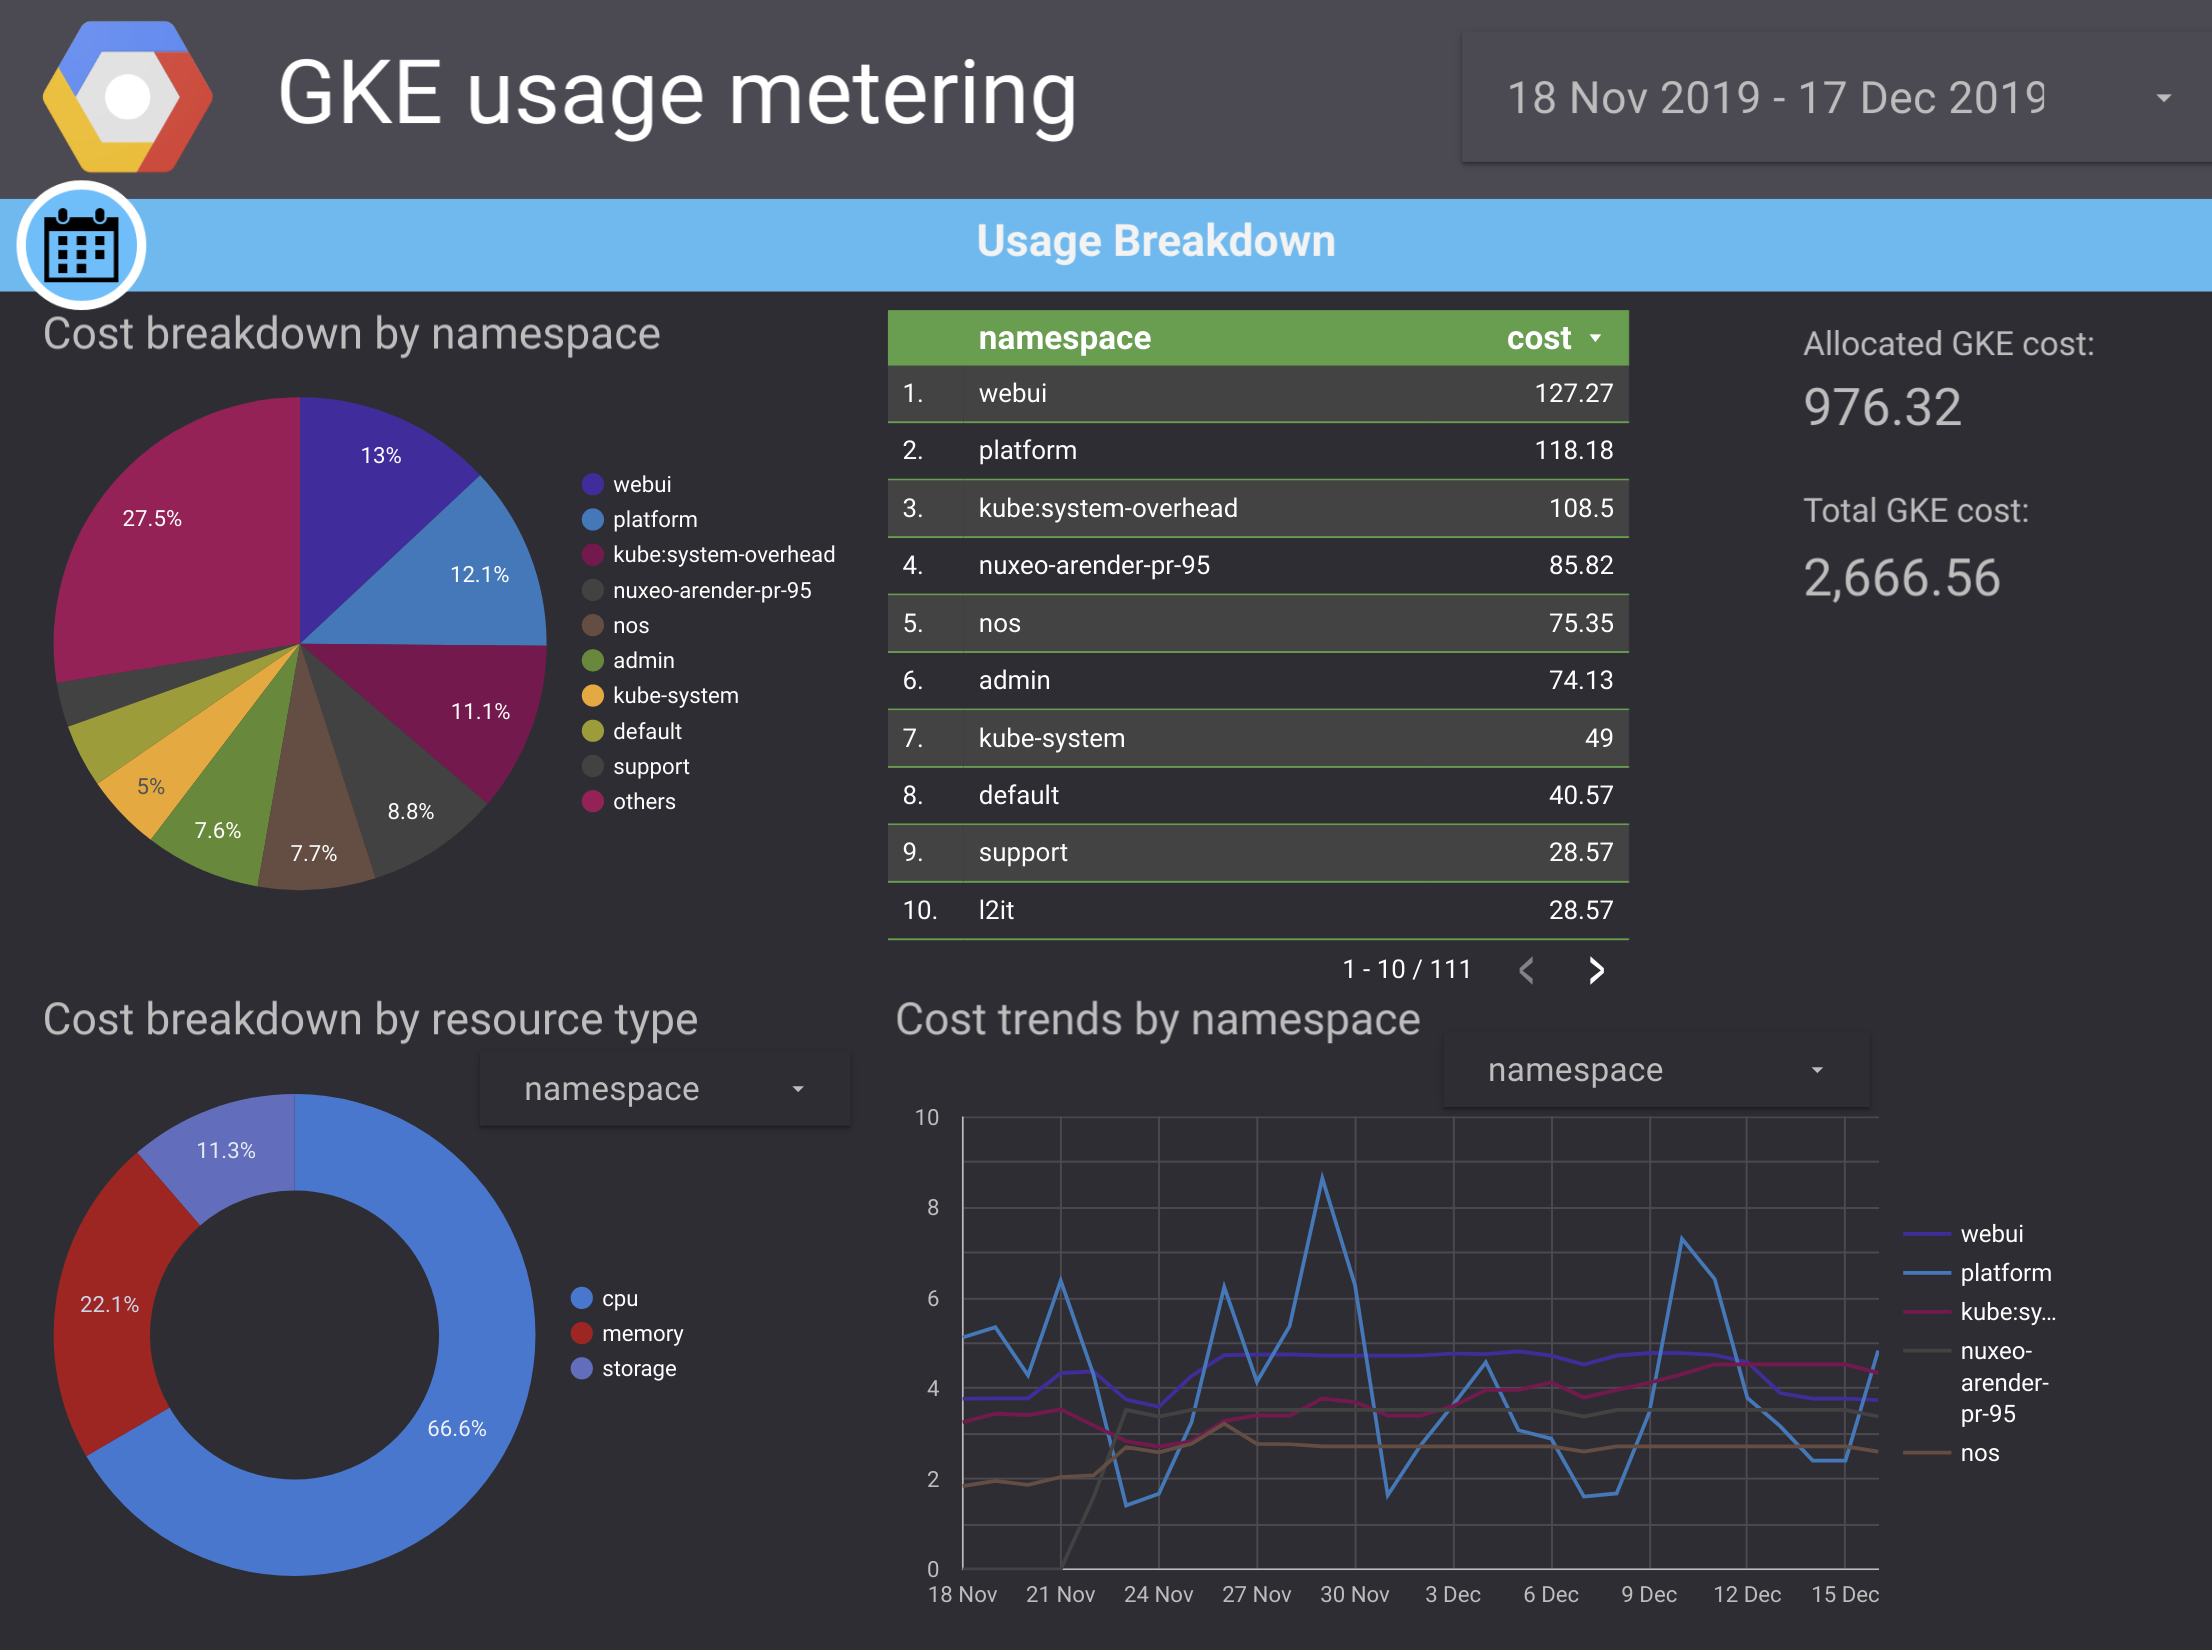
Google Data Studio
It allows it have interesting GKE Usage Metering reports based on the jx-preprod.GoogleBillingDetails.gcp_billing_export_v1_00E3A4_C28D15_595CC3 BigQuery table, see https://datastudio.google.com/datasources/1RgkQ95xH5j-070XBT6P3Nn1Qo-a5SAPN then EDIT CONNECTION.
Default report example, base on a namespace aggregation:
https://datastudio.google.com/reporting/1qZEwX6S4E51QlHlQ5X1G8z0y-mgL-HlK/page/bLKZ, see attached screenshot.
We could probably configure some fine-grained aggregations based on labels.
- is cloned by
-
-
- Open
-
- Is referenced in

