When indexing document with the Bulk Service the NXQL query materialize the document set to index, the processing is the following:
1. Index request computation, receiving bucket of ids (default 1000):
Read documents by batch (25 by default) and build a bulk request (here it is elasticsearch bulk api not our bulk service)
Create multiple es bulk request if the size exceed the maximum record size (1MB)
Convert each es bulk request into a DataBucket record
Send records downstream and checkpoint
2. Elasticsearch bulk indexing computation, receiving DataBucket
This computation use an elasticsearch processor to aggregate indexing request from multiple DataBucket/bulk requests
The elasticsearch processor handles: the optimal bulk request size (default 5MB), the retry in case of failure (3 retries with backoff).
Using the computation timer we force the processor flush (default every 10s) and checkpoint position
3. An index completion computation is reading the done stream for index command,
if the indexing command contains an option to refresh the index or update the aliases, the computation executes these post indexing actions
Note that the bulk indexing computation is generic and can also process delete request (or create, update but it is not used in Nuxeo so far).
Because we want to use this bulk action to re index an entire repository an automation operation Elasticsearch.BulkIndex similar to Elasticsearch.Index is provided, this operation will first drop and create an index (or create a new index when alias is enabled) before running an indexing command on the entire repository (on completion the alias is updated if necessary).
Here the curl syntax:
# Re-index default repository
curl -X POST 'http://localhost:8080/nuxeo/site/automation/Elasticsearch.BulkIndex' -u Administrator:Administrator -H 'content-type: application/json+nxrequest' -d '{"params":{},"context":{}}' | tee /tmp/bulk-command.txt
{"commandId":"4df12d8e-fe22-4796-a122-95d29d328d95"}

# extract the command id
commandId=$(cat /tmp/bulk-command.txt | jq .commandId | tr -d '"')

# ask for status
curl -s -X GET "http://localhost:8080/nuxeo/api/v1/bulk/$commandId"  -u Administrator:Administrator  -H 'content-type: application/json' | jq .
{
  "entity-type": "bulkStatus",
  "commandId": "cc46f734-832a-457c-a4e3-abadd25ea8fa",
  "state": "RUNNING",
  "processed": 10010,
  "total": 373119,
  "action": "index",
  "username": "Administrator",
  "submitted": "2018-10-31T10:37:49.124Z",
  "scrollStart": "2018-10-31T10:37:49.227Z",
  "scrollEnd": "2018-10-31T10:37:51.507Z",
  "completed": null,
}
The default re-indexing for the reference benchmark uses the following configuration:
elasticsearch.indexing.maxThreads=6
elasticsearch.reindex.bucketReadSize=1000
elasticsearch.reindex.bucketWriteSize=200
with 2 Nuxeo nodes this means 12 Nuxeo threads submitting requests to the 3 elasticsearch nodes.
The results is:
- 2118 docs/s or 373116 docs in 178s
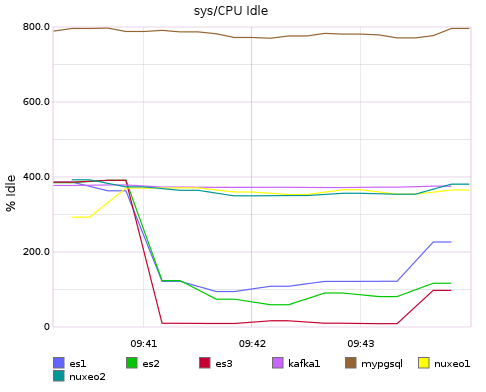
The monitoring during indexing shows that elasticsearch is the bottleneck.
The reindexing using the new BulkIndex operation uses only 4 Nuxeo threads (2 per nodes) and also saturates on elasticsearch it provides a similar throughput:
- 2048 docs/s or 373119 docs in 183s
{
  "entity-type": "bulkStatus",
  "commandId": "cc46f734-832a-457c-a4e3-abadd25ea8fa",
  "state": "COMPLETED",
  "processed": 373119,
  "total": 373119,
  "action": "index",
  "username": "Administrator",
  "submitted": "2018-10-31T10:37:49.124Z",
  "scrollStart": "2018-10-31T10:37:49.227Z",
  "scrollEnd": "2018-10-31T10:37:51.507Z",
  "completed": "2018-10-31T10:40:51.274Z"
}
The additionals seconds are probably due to the flush interval which may add up to 10s.
The monitoring is slightly different, the projection phase is fast ~1min where nuxeo and the db are a bit more solicited, but after on the pure indexing phase only elastic is loaded, nuxeo saturates easily elastic with less than 10% cpu (out of 400%)

- is related to
-
NXP-22110 Provides an Elasticsearch indexing impl with Computations
-

- Open
-

